This is a descriptive text analysis of my Twitter account, @estromgren. The public account was created in Oct. 2009 and had 10,700 published tweets as of this Nov. 2018 analysis date. I used Twitter during this period primarily as a marketing tool to promote my journalism content. Twitter was valuable in my four full-time positions during this time. There were 9,601 tweets published from those positions between Oct. 2009 and Aug. 2016.
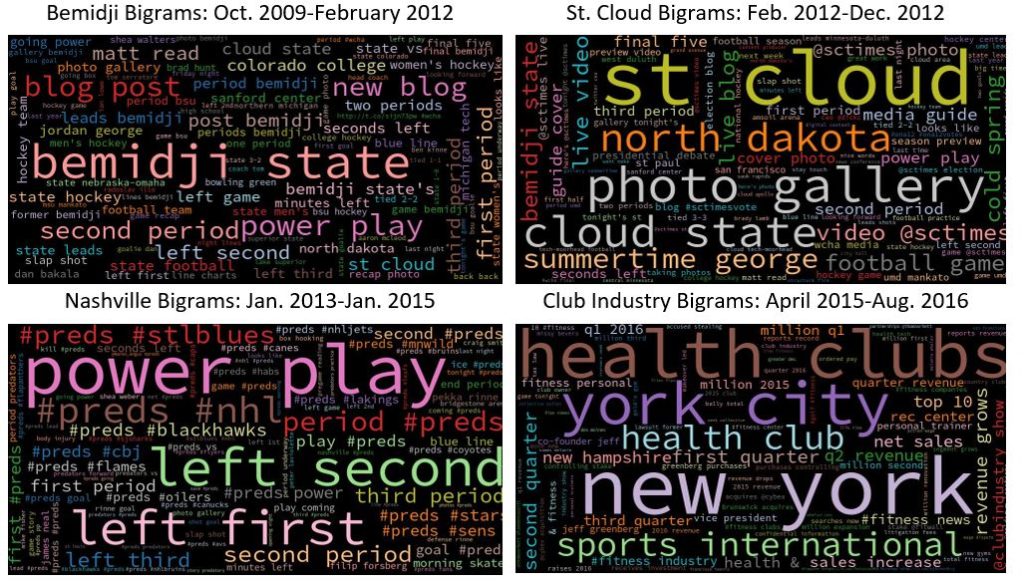
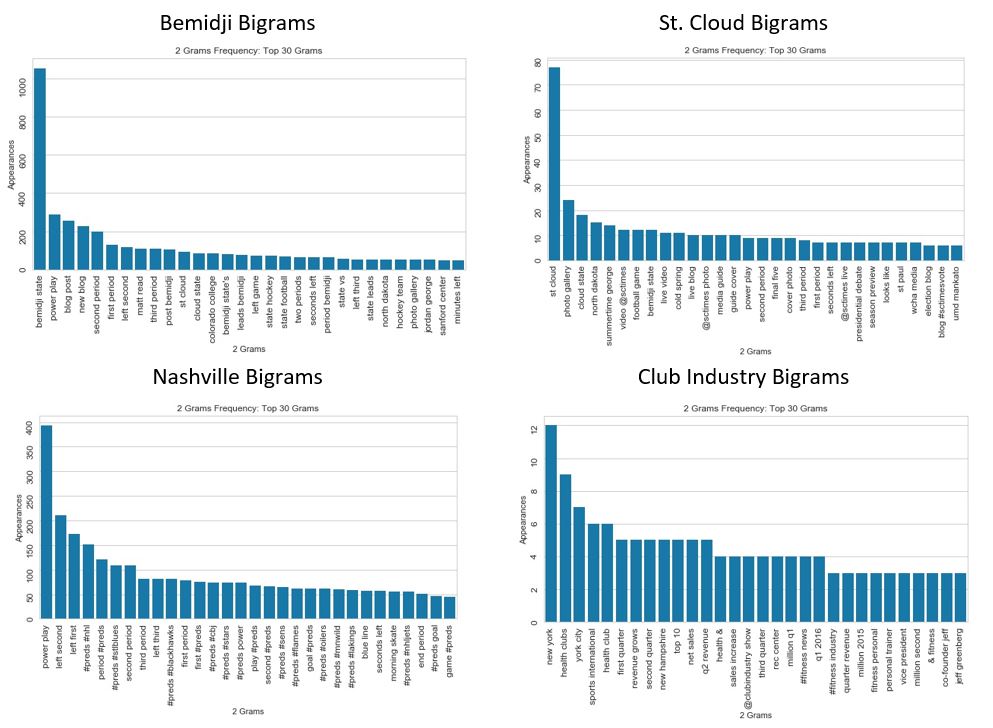
Python was used to scrape and process the 9,601 tweets segmented by the four job positions to show word cloud and frequency distribution visualizations of n-grams. Three jobs were sports journalism-based newspaper positions: I was a sports reporter at the Bemidji Pioneer; a digital content producer at the St. Cloud Times; and a content producer/NHL reporter the Nashville Tennessean. I then was a content producer covering the American fitness business for the Club Industry news website.
The common role shared by all four positions was news content generation. The bigram word clouds reveal my most frequent coverage topics (‘Bemidji State’, ‘Cold Spring’), news content types (‘new blog’, ‘photo gallery’) and newsmakers (‘Matt Read’, ‘Pekka Rinne’). All three sports position bigrams share high frequencies of hockey jargon (‘power play’) and live-game coverage hashtag combinations (‘#preds #stlblues’). The Club Industry bigrams show the coverage shift to business topics (‘health clubs’, ‘rec center’), companies (‘@Brunswick acquires’), financial reports (‘million q1’) and the trade show (‘@clubindustry show’).
This analysis could be a useful tool for journalists. Identification of high frequency n-gram combinations can help both the journalist and editors/managers refine content strategy around coverage priorities.